Planning for ’22 with Lessons from ‘21
In our latest issue, Andy Rothman discusses how last year’s experiences can help us plan for China’s 2022 economic prospects.
Subscribe"An easing cycle is underway which should result in stronger macro performance and improved sentiment among Chinese investors, who drive their domestic exchanges."
Looking back at last year’s experiences can help us plan for China’s 2022 economic prospects. This issue of Sinology summarizes the five key lessons: 1) An easing cycle is underway which should result in stronger macro performance and improved sentiment among Chinese investors, who drive their domestic exchanges; 2) The Chinese government has done a good job of balancing its public health and economic policy responses to the pandemic, and its zero-COVID approach is likely to remain in place this year; 3) Enforcement of its zero-COVID policy prevented China from once again having the world’s best consumer story last year, but consumer spending improved from the third to the fourth quarter, and consumption remained the main engine of economic growth; 4) Strong manufacturing output and exports allowed China to support global supply chains, and there are no signs of that faltering; and 5) The residential property market came under severe pressure from government policy during the second half of last year, but this pressure is already beginning to lift, and I expect the market to show signs of recovery by the summer.
Greater prospects for easing
Prospects for easing of monetary, fiscal and regulatory policies have improved.
In the January 4 issue of Sinology, I wrote that “Through words and actions, China’s leaders have in recent weeks signaled a change of direction for the government’s economic policy, towards one more supportive of growth, in contrast to 2021’s focus on de-risking and tighter regulation. This will be a modest, gradual stimulus, but it should be big enough to reverse the macro slowdown that resulted from last year’s overly tight policies.”
In recent days, this easing trend has picked up momentum. Most importantly, a vice governor of the central bank, in a January 18 press conference, said monetary policy will be “more proactive” and “front-loaded.” For a Chinese central bank official, the comments were unusually forceful. He said the central bank “must hurry up to act” and “move ahead of the market,” and he said they would take steps to “prevent the situation of market apathy caused by a prolonged lack of policy response.” The vice governor added that the central bank will “open the monetary policy toolbox wider” and he encouraged financial institutions to “not only welcome customers to the door but also take the initiative to find good projects.”
At the start of this month, I wrote that “the top risk is that the Chinese government’s easing program starts out too cautiously and does not ramp up adequately until after the National People’s Congress session in March. That would delay the macro recovery until the second half of 2022.” After hearing the central bank governor say, “Although it is the beginning of the year, the time of a year is very short . . . we must hurry up,” I’m now far less concerned about an overly cautious start.
The day before the press conference, the central bank cut two policy interest rates by 10 basis points (0.10%), which followed December cuts to the one-year loan prime rate and to bank required reserve ratios.
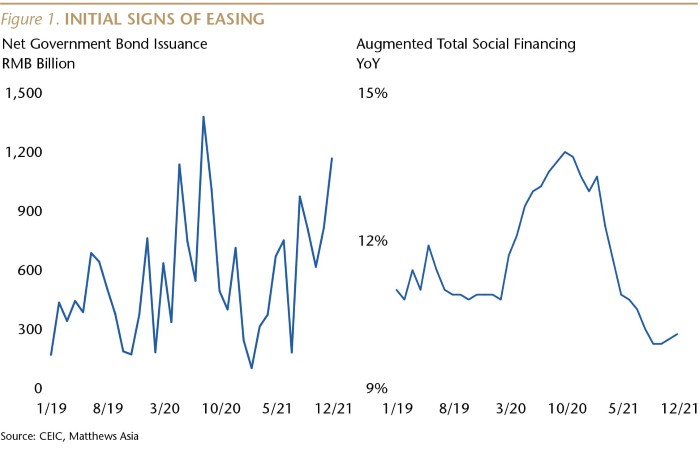
Government bond issuance has been rising since August, and total credit growth (augmented total social finance), which includes both bank loans and bonds, has been ticking up since November, following eight months of deceleration.
In addition to monetary and fiscal policy easing, I also expect policy changes designed to support the housing market and make the corporate regulatory environment more stable.
The central bank has signaled greater availability of mortgage loans, although cash down-payment requirements will remain strict. And, in December, senior officials suggested that while last year’s regulatory changes will continue to be implemented, there will not be a new regulatory crackdown in 2022.
I am confident that the easing cycle underway in China will result in stronger economic performance and improved sentiment among Chinese investors, who drive their domestic exchanges.
The impact of China’s zero-COVID policy
The Chinese government, after mishandling the initial outbreak of COVID in early 2020, has adopted policies which have emphasized public health over economic growth, in contrast to most countries, which have chosen less aggressive measures to limit the spread of the disease. From a public health perspective, China’s approach has been successful.
It is important to recognize that China’s “zero-COVID” policy isn’t intended to ensure zero cases, but rather reflects a zero tolerance for the spread of the disease.
On January 23, there were only 2,754 COVID patients in Chinese hospitals, compared to more than 150,000 in the U.S., while the population of China is more than four times larger than that of the U.S. Since the start of last year, there have been only two COVID deaths in China, while there have been over 510,000 deaths in the U.S. during that period, and as of January 21, 2022, there were 1,974 COVID deaths per day, on a seven-day moving average basis.
Since the start of the pandemic, China has experienced three COVID deaths per one million population, while the U.S. has seen 2,662 deaths per million. (To put this into context, New Zealand and Taiwan have had less than 40 deaths per million; Australia, South Korea, Singapore and Japan are all at less than 200 deaths per million population.) If China were to have the current U.S. COVID death rate, it would be equal to over 8,000 deaths per day, and its hospitals would be overwhelmed.
The Chinese government has made important mistakes in implementing its zero-COVID policy. Some cities have been poorly prepared, and Beijing has refused to approve the use of more effective, foreign-developed mRNA vaccines, while it waits to complete trials for domestic mRNA jabs. The government’s aggressive approach toward containing COVID, which has occasionally resulted in major cities being locked down, has had a significant impact on China’s economy. Of course, this is a global problem, including in places where public health policies are far more relaxed. In the U.S., for example, restaurants, retailers and airlines have struggled to find enough workers to provide normal service. In early January, more than 14 million Americans did not work at some point because they had COVID, were caring for someone with COVID, or had to look after a child whose school or daycare was closed, according to the U.S. Census Bureau.
Recently released data reflects that China’s economy was weakened by COVID last year, but still grew faster than most other economies.
The growth rate of GDP is one of the least accurate, but most watched statistics in China, so let’s start here. Real (inflation-adjusted) GDP growth of 8.1% year-over-year (YoY) for 2021 was the fastest full-year pace since 2012. Another way to look at it is that the incremental expansion in the size of China’s nominal GDP last year (an increase of RMB 13 trillion, or about US$ 2 trillion, roughly equal to the size of Italy’s economy) was the largest in the country’s history.
Figure 2 illustrates that key macro data continued to recover last year from the worst impact of COVID in 2020.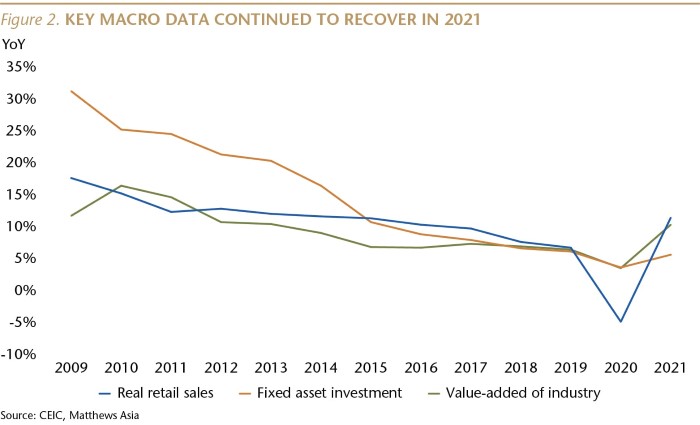
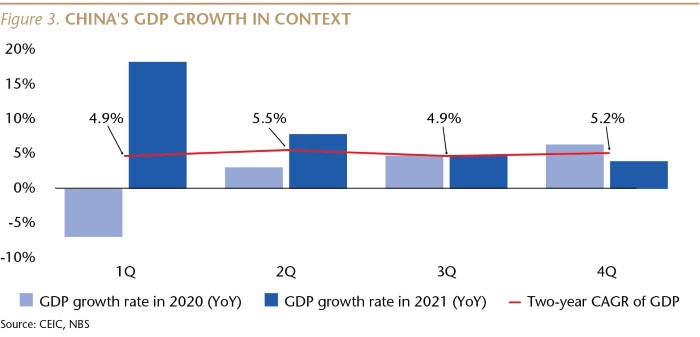
The pace did slow in the fourth quarter, but real GDP growth of 4% YoY wasn’t too bad. (For context, the U.S. economy grew at an annual rate of 2.3% in 3Q21, the most recent data available.) However, this isn’t a very useful statistic for understanding the sustainability of the economic recovery.
In April of last year, I wrote that it would be “fantasy” to focus on the 1Q21 real GDP growth rate of 18.3% YoY, as that pace was distorted by the base, given that GDP had fallen 6.9% YoY in 1Q20. Instead, I explained that it is more helpful to compare the latest data to that from the pre-pandemic period by using compound annual growth rates (CAGR).
In 3Q21, on a two-year CAGR basis, real GDP growth bottomed at 4.9% and then ticked up to 5.2% in 4Q21. This was supported by strengthening industrial production (up on a two-year CAGR basis by 5.5% in 4Q21 vs. 5.3% in 3Q21), and by retail sales (up 4.1% on a two-year CAGR basis in 4Q21, compared to 3% in 3Q21).
Overall, it appears the Chinese government did a good job of balancing its public health and economic policy responses to the pandemic. We may not agree with how the government implemented its zero-tolerance approach, and this policy would not have worked in the U.S., but we should acknowledge that it was accepted by most Chinese citizens and it has been relatively successful. Edelman, an American public relations firm, published on January 18 the 2022 edition of its annual “trust barometer.” Its global survey found that, “Trust among Chinese citizens in their government is a record 91 percent, the highest seen in a decade. The result is even more striking compared to the U.S., where trust in government is at 39 percent.”
For the moment, no longer the world’s best consumer story
Enforcement of its zero-COVID policy prevented China from once again having the world’s best consumer story last year. On a two-year CAGR basis, real retail sales in China rose 2.4%, while in the U.S., supported by large government transfers to households, retail sales increased 6.3%.
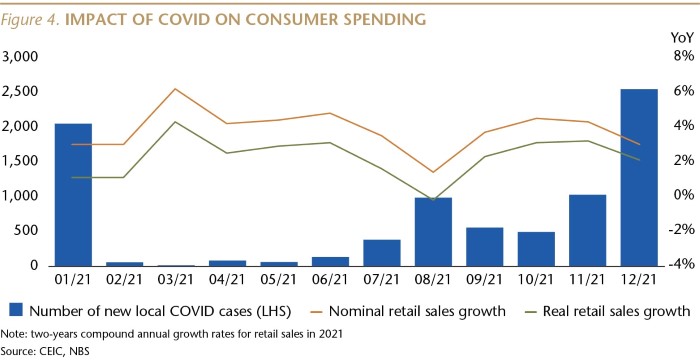
It is clear that during months in which the number of COVID cases, and the number of provinces with outbreaks, was higher, consumer spending was depressed. The number of daily cases across the country was very small—averaging 145 in the first 23 days of January, compared to hundreds of thousands per day in the U.S.—but fear of getting caught up in the strict COVID quarantine bureaucracy led many people to limit their activities. It is possible that the zero-COVID approach may fail to contain Omicron, but that is not reflected in the latest data.
Among the worst-hit sectors were food services and travel. Restaurant and bar sales, for example, declined 0.5% last year, on a two-year CAGR basis, compared to a 9.4% YoY growth rate in 2019.
Income growth also slowed last year. Per capita disposable household income rose 6.9% on a two-year CAGR basis, down from 8.9% YoY growth in pre-pandemic 2019.
One of the bright spots was online sales of goods, which rose 13.4% on a two-year CAGR basis. Online sales accounted for 24.5% of total retail sales, up from a 20.9% share in 2019, despite the government’s regulatory crackdown on large online platforms.
Another positive is that consumer spending improved from the third quarter (up 3%) to the fourth quarter (up 4.1%, both on a two-year CAGR basis). The improving trend may continue, unless the Omicron variant keeps more people at home.
A third positive is that the pandemic did not interrupt the long-running rebalancing of the Chinese economy. Last year was the 10th consecutive year in which the services and consumption (tertiary) part of China’s GDP was larger than the manufacturing and construction (secondary) part.
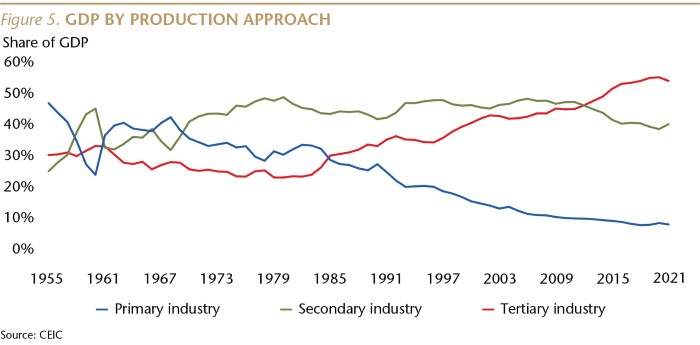
Consumption does not yet play as large a role in China’s economy as in most developed countries (final consumption is about 54% of China’s GDP, compared to about 82% in the U.S. and the U.K.), but this transformation towards a domestic demand-driven economy is well under way and will likely continue, offering opportunities to investors.
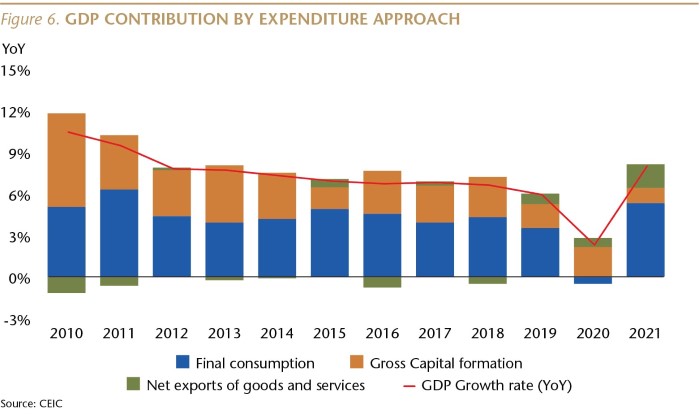
Consumption also continued to drive China’s economic growth last year. Final consumption accounted for 46% of GDP growth in 2021, while gross capital formation contributed 31% and net exports accounted for 23% (all on a two-year CAGR basis).
Still not an export-led economy
China’s exports have boomed during the pandemic, reflecting that the country’s zero-COVID policy has kept factories humming while production in much of the rest of the world was sidelined, leading to strong demand for Chinese goods. Last year, net exports—the value of a country’s exports of goods and services minus its imports—accounted for the largest share of China’s GDP growth since the country joined the World Trade Organization two decades ago, but final consumption still accounted for an even larger share of growth, and remains the largest part of the economy.
Exports rose 21% YoY in local currency terms in 2021, and were up 26% compared to pre-pandemic 2019. Imports increased by about 21% compared to both 2020 and 2019. And it’s worth noting that the share of China’s trade conducted by privately owned companies continued to rise last year, accounting for 49% of the total value, up from about 28% a decade ago and 7% two decades ago.
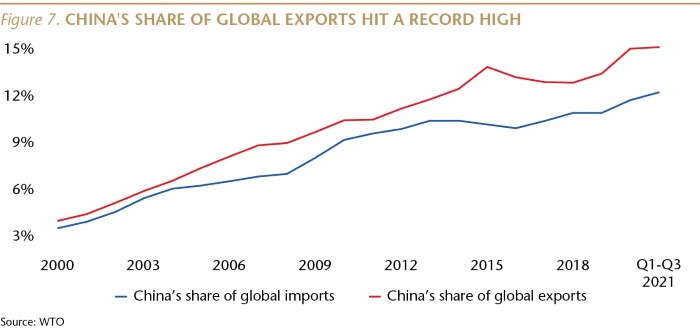
Demand for Chinese goods was so strong that China’s share of global exports reached an historical high of 15% for the first three quarters of 2021, the latest data available. That was up from a 13.3% share in 2019.
Even in the U.S., talk of a trade war and a big jump in tariff rates had only a modest impact on demand for Chinese goods, which accounted for 17.7% of all U.S. goods imports through last November, down from the 21.5% share during the same period of 2017, before the tariff hikes. (And it is clear that American companies and consumers bore the burden of those tariffs.)
This data suggests that despite zero-COVID, China was a positive contributor to global supply chains in 2021, and that is likely to continue this year.
Net exports contributed far more than usual to China’s GDP growth during the last two years, but this was still far smaller than the contribution to growth from final consumption. Net exports accounted for 23% of GDP growth in 2021, compared to a 46% share for final consumption, and 31% from gross fixed capital formation (all on a two-year CAGR basis). This is a big change from the period 2010 to 2019, when, on average, net exports were a negative drag on annual GDP growth.
But this outsized contribution to growth from net exports should be a temporary phenomenon, for two reasons. First, when COVID recedes and manufacturing output recovers around the world, the growth rate of foreign demand for Chinese-made goods will return to normal. Second, the net export contribution is usually moderated by China’s deficit in trade of services, much of which stems from overseas travel by Chinese tourists and businesspeople. That deficit has shrunk dramatically, as its zero-COVID policy has kept people from traveling. This too, will eventually return to normal, and then the net export contribution to China’s GDP growth, as well as the size of its trade surplus, will likely return to pre-pandemic levels.
Property under pressure, but policy relief in sight
The residential property market, a key part of China’s economy, came under severe pressure from government policy during the second half of last year, but this pressure is already beginning to lift, and I expect the market to show signs of recovery by the summer.
It is important to note that the pressure on the housing market was caused by government actions which were designed to stress that market, but which went too far (as is often the case with policy initiatives in China). Weak fundamental demand was not the problem.
In 2020, the government limited the ability of poorly managed, highly indebted real estate developers to borrow from banks. Then, last May, the government instructed banks to severely limit issuance of mortgage loans to homebuyers. As a result, after a strong first half, the market was frozen in the second half of last year.
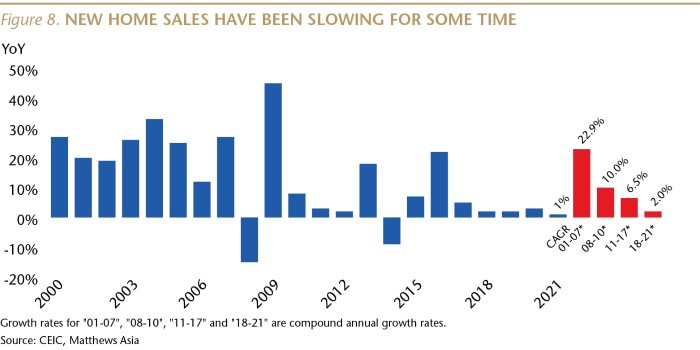
The strong first half meant that full year data wasn’t too bad. New home sales rose 1.1% YoY on a square meter basis, and 2.1% on a two-year CAGR basis, similar to the 2019 pace of 1.6%. Over the last six years, we estimate that the average number of new housing units (almost all apartments) was 13.3 million per year, with 13.7 million sold last year.
As Figure 8 illustrates, the growth rate of new home sales in China has been slowing gradually for many years, as the market has matured.
The picture was similar for last year’s new home prices, as well as prices in the secondary market. After rising in the first half of the year, prices slipped a bit, on a month-on-month basis, in each of the last six months, after the government restricted mortgage availability. For the full year, however, the average new home price rose 4% YoY.
Average new home prices have been rising steadily for many years. At this point, average prices are 12% higher than two years ago, and are up 44% over five years, and 107% over 10 years. Especially given that the minimum cash down-payment for a new home is 20% of the purchase price, it is very unlikely that a material number of homeowners are under water.
Prices are up across all tiers of cities. In the smaller, tier three cities—where 64% of the urban population lives and where about 67% of new home sales take place—average prices are up 5% over 2019, 32% over 2016, and 40% over 2011.
Overall, prices have been rising roughly in line with income growth. Over the last five years, home prices rose at an average annual pace of 7.7%, while per capita urban household income rose at an average annual rate of 7.1%. Over the last 10 years, home prices increased at an average annual rate of 7.6%, compared to average annual income growth of 8.1%.
Government officials have recently acknowledged that they put too much pressure on the property market, and have signaled that they will take a less restrictive approach this year. The central bank has signaled greater availability of mortgage loans, although cash down-payment requirements will remain strict. Commercial banks, no doubt acting on government instructions, have accelerated mortgage approvals. There is plenty of pent-up demand that wasn’t met during the second half of last year, so the growth rate of sales and prices is likely to recover by mid-year.
Two other property issues have been in the news lately. One is the concern that weaker purchases of land by developers from local governments last year will have a negative impact on official budgets. We don’t yet have final data for last year, but if land sale revenue were to have fallen by 25% compared to 2020, in line with the worst market in China’s history (in 2015, when government policy also froze the market, at a time when unsold housing inventory was at a record high), that could have resulted in a decline of gross land transfer revenue of about RMB 2.1 trillion.
But about half of land transfer revenue goes as compensation to displaced citizens, often farmers, so the real decline for local governments could have been about RMB 1 trillion (about US$ 165 billion). However, because infrastructure spending was basically flat last year, we estimate that Beijing has a large fiscal carryover that provides plenty of capacity to top up the budgets of local governments, which are, effectively, branch office of the central government, rather than independent political entities. Moreover, a recovery in new home sales this year would lead to a future recovery of land sales.
The second issue in the news has been defaults by 10 Chinese developers on their debts. We estimate that these developers combined accounted for about 7% of new home sales, on a square meter basis, in the first half of 2021. The largest of those is China Evergrande Group, which accounted for about 5% of sales.
My colleague, Teresa Kong, head of our fixed income team, and I wrote about Evergrande last year, and I’d like to repeat a few of the points we made.
We believe Evergrande’s financial problems are highly unlikely to create a risk to China’s financial system. The company does have a large debt burden, but it is insignificant given the scale of China’s financial system. It's worth noting that, in recent years, two companies with similar magnitude debt burdens, Anbang and HNA, were successfully restructured without creating systemic damage. As in the past, we expect the government to take an active role in managing the restructuring of Evergrande to mitigate the risks, by ensuring that its current liquidity problem does not become an insolvency problem and a bigger crisis of confidence in the Chinese financial system. At least three of Evergrande’s projects have already been sold, in full or in part, to state-owned developers, who will be focused on ensuring delivery of completed units to homebuyers.
China’s housing market has matured, so the boom days are past, but it is generally sound and has not been generating the kind of financial system risks that developed in the U.S. during the decade prior to the Global Financial Crisis, in part because China’s regulators have learned from our mistakes. Chinese banks have not been permitted to make irresponsible mortgage loans, and homebuyers are required to put down a lot of cash. There is very little mortgage securitization and most banks hold mortgages through maturity, so they have a clear incentive to avoid lending to risky borrowers.
Manufacturing held up well under COVID
China’s manufacturing sector held up well under COVID, and strengthened at the end of last year, supporting global supply chains. Privately owned manufacturers expanded production faster than state-owned enterprises (SOEs), and private investment increased at close to the same pace as investment by SOEs.
Industrial production rose 6.1% on a two-year CAGR basis in 2021, faster than the pre-pandemic pace of 5.7% YoY in 2019. The slowest growth rate was recorded in September, and then the pace accelerated each month through December, suggesting a good start for 2022. Output rose at a faster pace at private manufacturers than at SOEs. (See Figure 2.)
Manufacturers seemed optimistic about the future, with investment up 4.8% on a two-year CAGR basis, faster than the 3.1% rise in 2019. Investment by privately owned firms rose almost as fast as that by SOEs, and investment by private companies has increased every year for the past decade.
The utilization rate of industrial capacity was 77.5% last year, up from 74.5% in 2020 and 76.6% in 2019.
This data, along with China’s exports hitting an all-time high share of global exports in the first three quarters of last year, indicate that the country’s manufactures have continued to contribute positively to global supply chains.
Lessons
These lessons can help us look ahead to China’s 2022 economic prospects. The easing cycle should result in stronger macro performance and improved sentiment among Chinese investors. The zero-COVID policy was very successful from a public health perspective and is likely to remain in force; and while it was a drag on some consumer sectors, spending improved from the third to the fourth quarter, and consumption remained the main engine of economic growth. Strong manufacturing output and exports allowed China to support global supply chains, and there are no signs of that faltering. The residential property market came under severe pressure from government policy during the second half of last year, but this pressure is already beginning to lift, and I expect the market to show signs of recovery by the summer.
Andy Rothman
Investment Strategist
Matthews Asia
As of December 31, 2021, portfolios managed by Matthews Asia did not hold China Evergrande Group, Anbang Insurance Group or HNA Group.