Is This the Real Life? Is This Just Fantasy?
China’s first quarter macro results are a mix of fantasy and real life, and distinguishing between the two are important for understanding the sustainability of the post-pandemic economic recovery.
China’s first quarter macro results are a mix of fantasy and real life, and distinguishing between the two are important for understanding the sustainability of the post-pandemic economic recovery.
The fantasy is the year-on-year (YoY) comparison to the first quarter of last year, when much of China was shuttered in response to COVID-19. The weak base results in figures such as a 33.9% YoY rise in real (inflation-adjusted) retail sales, because those sales declined 22% in the first quarter of last year. Similarly, industrial value-added rose 24.5% YoY in 1Q21, following an 8.4% decline a year ago. The base effect also generated a fantastical 1Q21 GDP growth rate of 18.3%, as GDP fell 6.8% YoY in 1Q20.
Clearly, comparisons to the first quarter of last year are not a useful guide to the coming quarters. Real life, however, can be discerned by comparing the latest data to pre-pandemic, 1Q19 data. This comparison reflects a healthy, sustainable, domestic-demand driven economy, albeit one which has not yet fully shaken off all of the impact of the pandemic.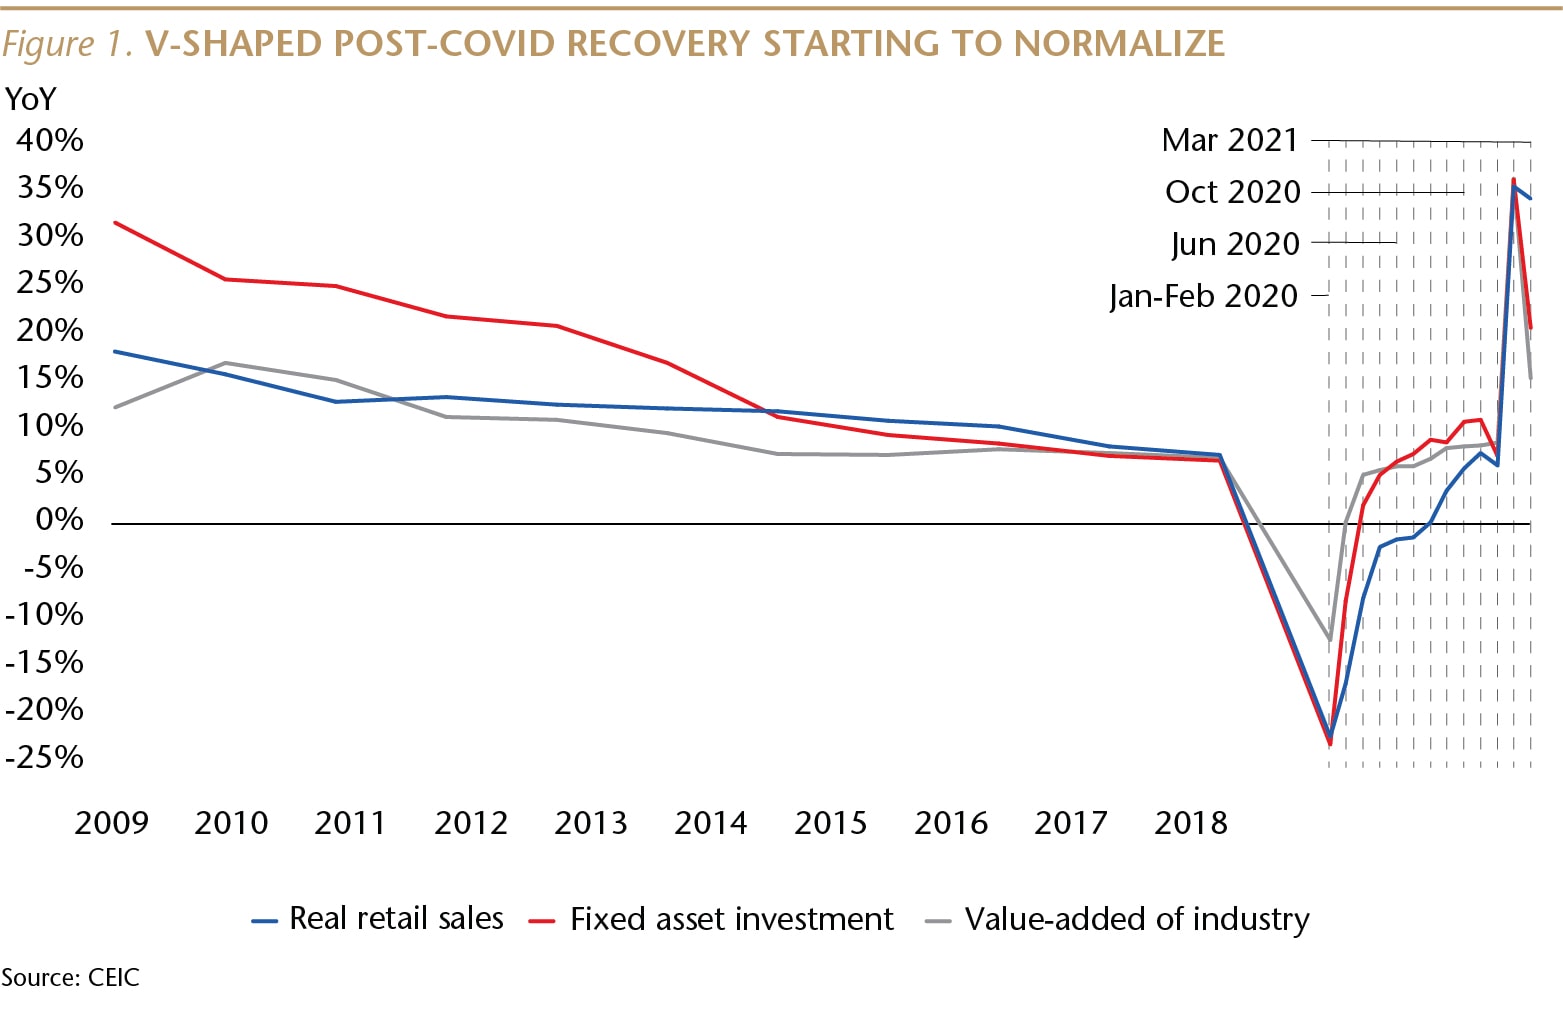
Real retail sales, for example, rose 4.6% in 1Q21, compared to pre-pandemic 1Q19. Another, helpful perspective is that the compound annual growth rate (CAGR) of real retail sales was 2.3% over the last two years, compared to a 6.9% YoY pace in 1Q19. Consumer spending is bouncing back, but still has a ways to go to catch up to its pre-COVID growth, as lingering health concerns continue to depress desires to gather indoors.
Industrial value-added in the first quarter of this year rose 14% compared to 1Q19. The CAGR was 6.8% over the last two years, faster than the 6.5% rise in 1Q19. Manufacturing has recovered from the virus.
GDP expanded by 10.3% over the same period two years ago. The CAGR was 5.0% over the last two years. A fast pace but a bit weaker than the 6.3% YoY rate in 1Q19.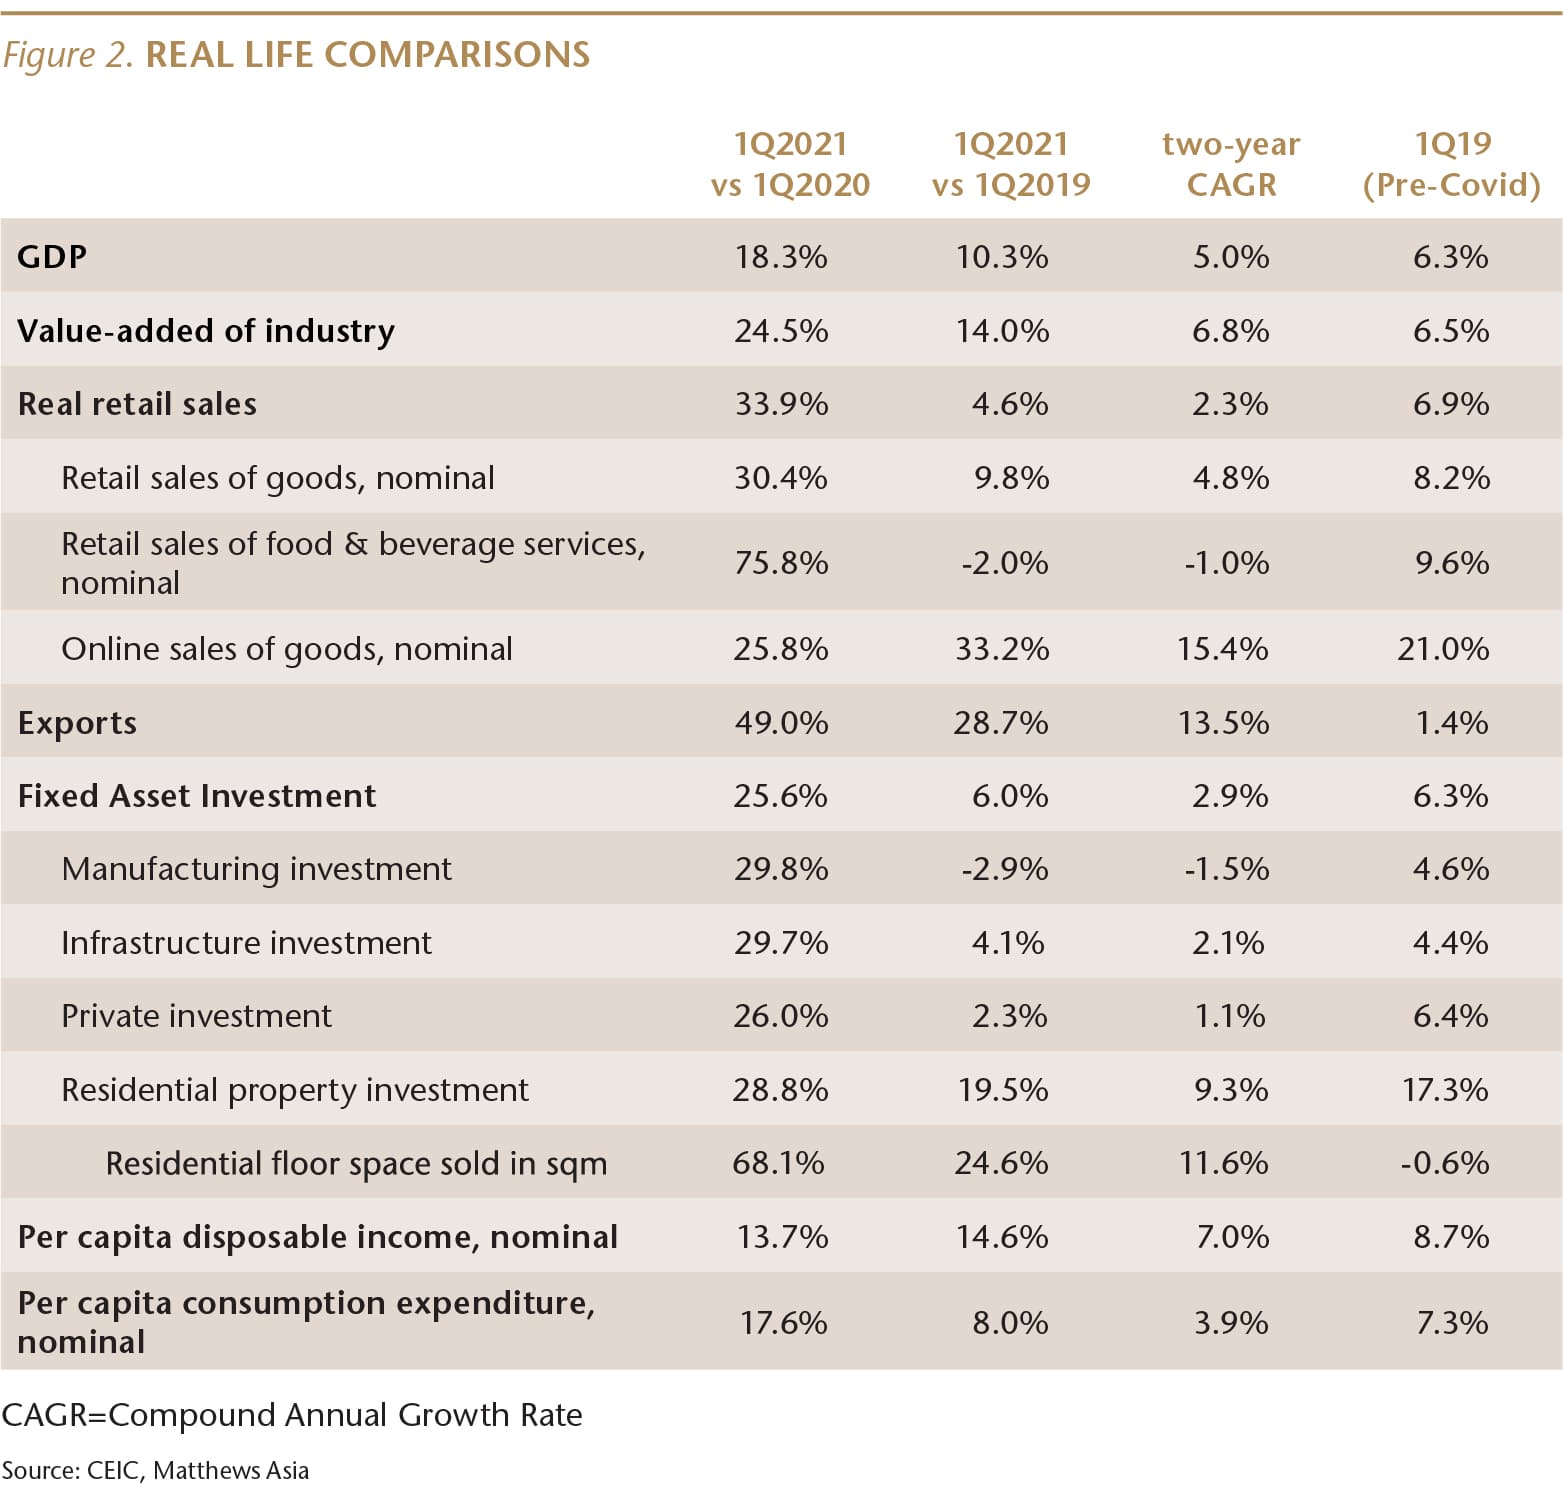
Consumption bouncing back
Despite not having fully returned to pre-pandemic levels, China remains the world’s best consumer story. Household consumption spending, which includes a wider range of services compared to the retail sales data, rose 8% compared to 1Q19. Online retail sales of goods rose 33.2% compared to 1Q19.
The strong local data is consistent with Nike’s results for their most recent quarter in greater China, through February, where the company said it “achieved its second consecutive $2 billion quarter and grew 42% on a currency-neutral basis with EBIT growth of 75% on a reported basis.”
This consumer spending has been driven by a very strong recovery in the growth rate of per capita disposable income, which rose 14.6% in the first quarter compared to 1Q19.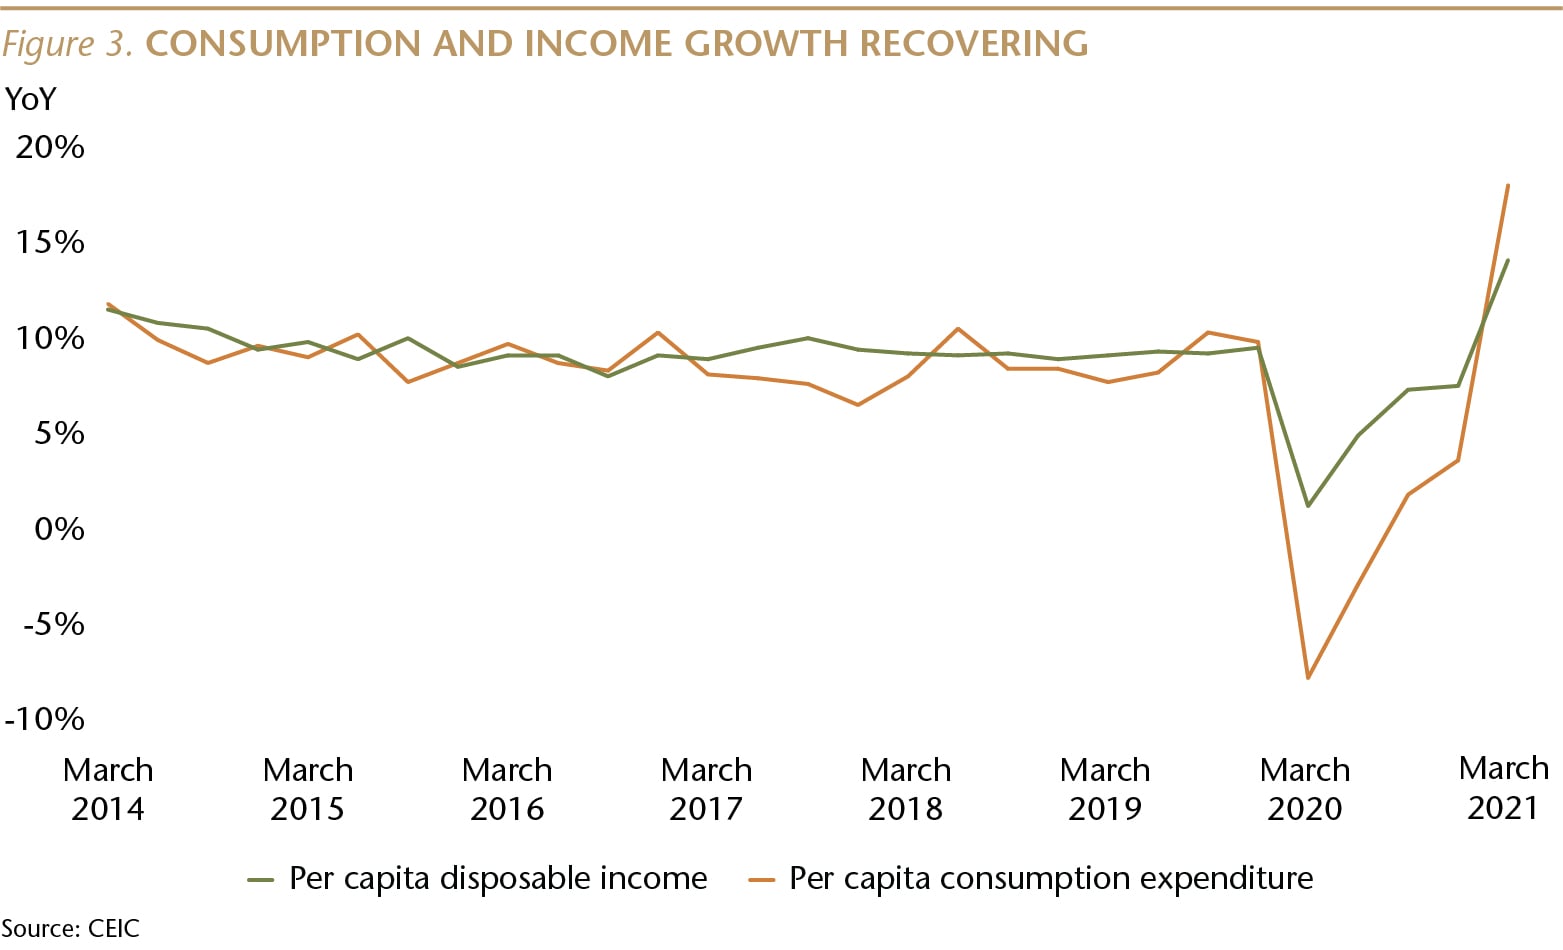
While consumer spending has generally bounced back, lingering COVID fears continue to slow the recovery of restaurant and bar sales, which declined 2% compared to 1Q19. However, with very few outbreaks last month, sales of food and beverage services increased 91.6% YoY in March, an increase of 3.5% over the same month in 2019. With vaccines being rolled out across China, and much of the rest of the world, the retail recovery is likely to accelerate in the coming quarters. Movie ticket sales hit an all-time monthly high in February, despite COVID-restrictions that limited occupancy of theaters—one sign that consumers are increasingly comfortable gathering indoors.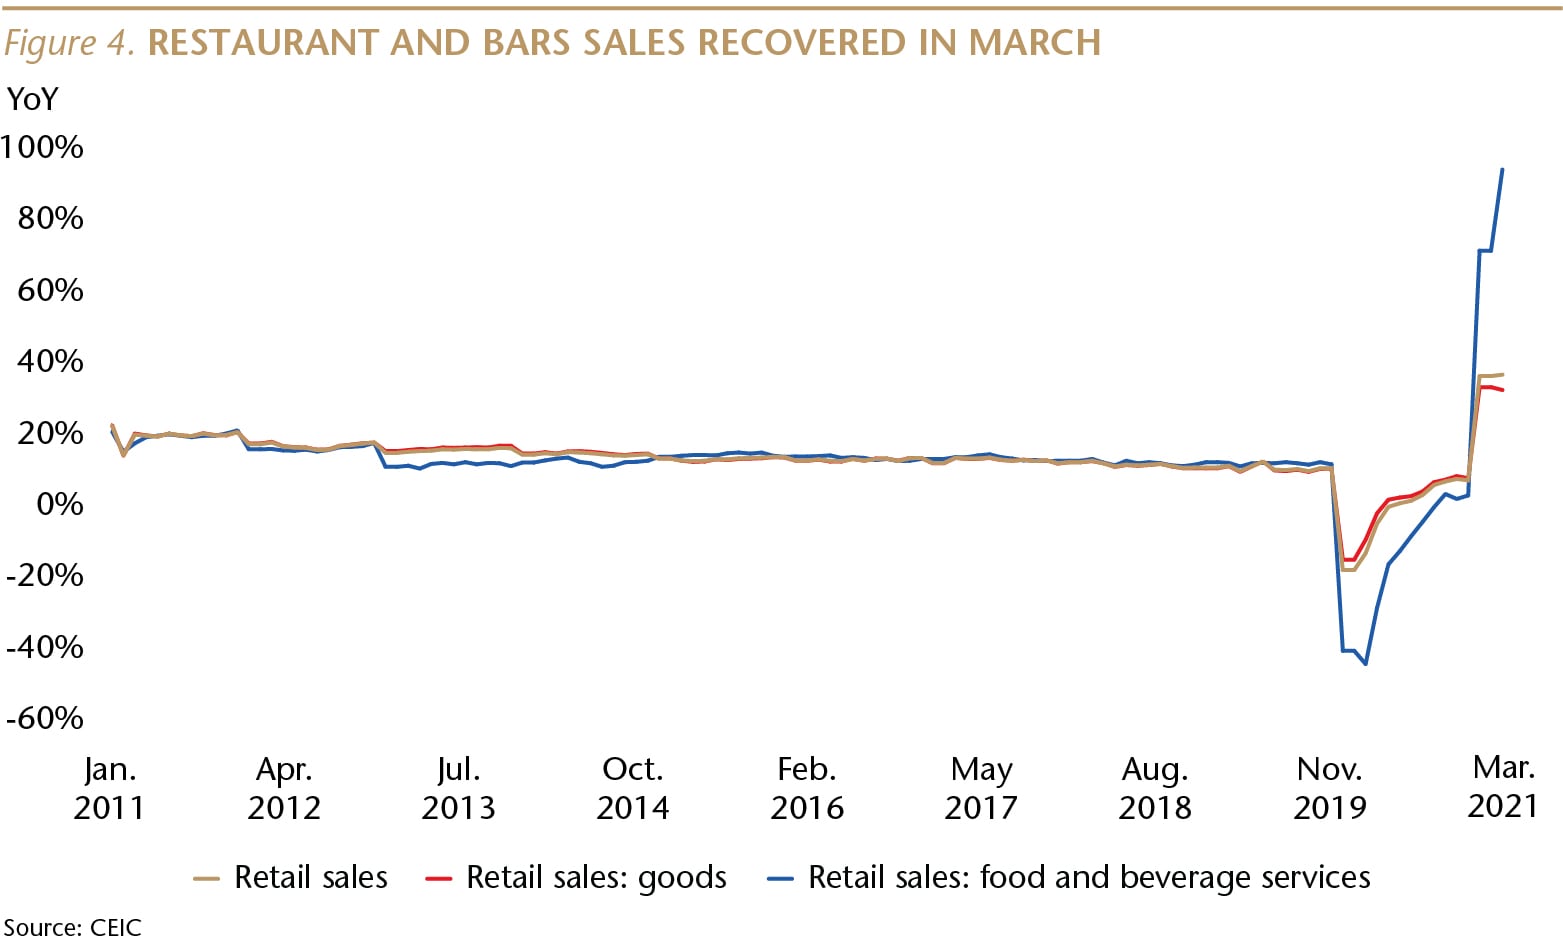
A high propensity to save also backstops strong spending. Household bank deposits have been rising at a double-digit YoY pace every month since November 2018, and as COVID fears continue to recede and income growth returns to normal, it is likely that consumers will draw down some of that savings in the coming quarters.
Housing Healthy
First quarter new home sales rose 24.6% compared to pre-pandemic 1Q19, on a square meter basis. Sharp increases in home prices have been limited to a small number of cities, and overall, prices have risen in line with income. Over the 10 years through 2019, prior to the pandemic, new home prices rose at an average annual pace of 7.7%, while nominal urban income rose at an average rate of 9.5%. The pandemic has interrupted this balance, with new home prices up 16.3% YoY in 1Q21, compared to a 12.2% YoY increase in nominal urban income, but this is likely a temporary aberration.
China’s housing market is not generating the kind of financial system risks that developed in the U.S. during the decade prior to the Global Financial Crisis, in part because China’s regulators have learned from our mistakes. In fact, because homebuyers are required to use a lot of cash and because banks have not been permitted to make irresponsible loans, mortgages may be among the safest of bank assets in China.
Chinese homebuyers who use a mortgage must put down at least 20% cash for a primary residence (and much more for an investment property), in sharp contrast to the 2% median cash down payment in the U.S. in 2006.
It is also worth noting that Chinese banks have not been permitted to engage in the “financial engineering” that caused the U.S. crisis. For example, nearly one-quarter of all mortgages originated in the first half of 2005 in the U.S. were interest-only loans. Those do not exist in China.
There is very little mortgage securitization in China, and most banks hold mortgages through maturity, so they have a clear incentive to avoid lending to risky borrowers.
And the government has been continually fine-tuning its policies to limit property market speculation and promote the construction of lower-cost housing. Recent regulations have also limited bank exposure to the property sector.
China does face a serious property problem—but it is a social and political problem. In larger cities, many residents are priced out of the market and may never be able to afford to own a home. This problem—shared by cities such as San Francisco, New York and London—is a long-term challenge, and it’s one with consequences that are very different from a housing bubble.
Inflation Modest
CPI was flat in the first quarter compared to a year ago, due largely to a 12.5% YoY decline in the price of pork, China’s primary protein source. This was the result of a very high base last year, when an outbreak of African Swine Flu led to hog deaths and meat shortages, pushing prices up by almost 50% YoY.
This year, we expect the high base to keep food price inflation low, which will offset a modest rebound in services prices as COVID concerns recede. As a result, CPI will likely have little impact on China’s post-COVID monetary policy decision-making.
Industrial profits on track
During the first two months of the year (the latest data available), profits at larger industrial firms were up 72% compared to the same period two years ago, prior to COVID. Operating margins for these firms (many of which are not listed on a stock exchange) reached levels not seen since 2011. Capacity utilization rates have also been at record levels in recent years. As China and much of the world recover from COVID, industrial profits are likely to remain healthy in the coming quarters.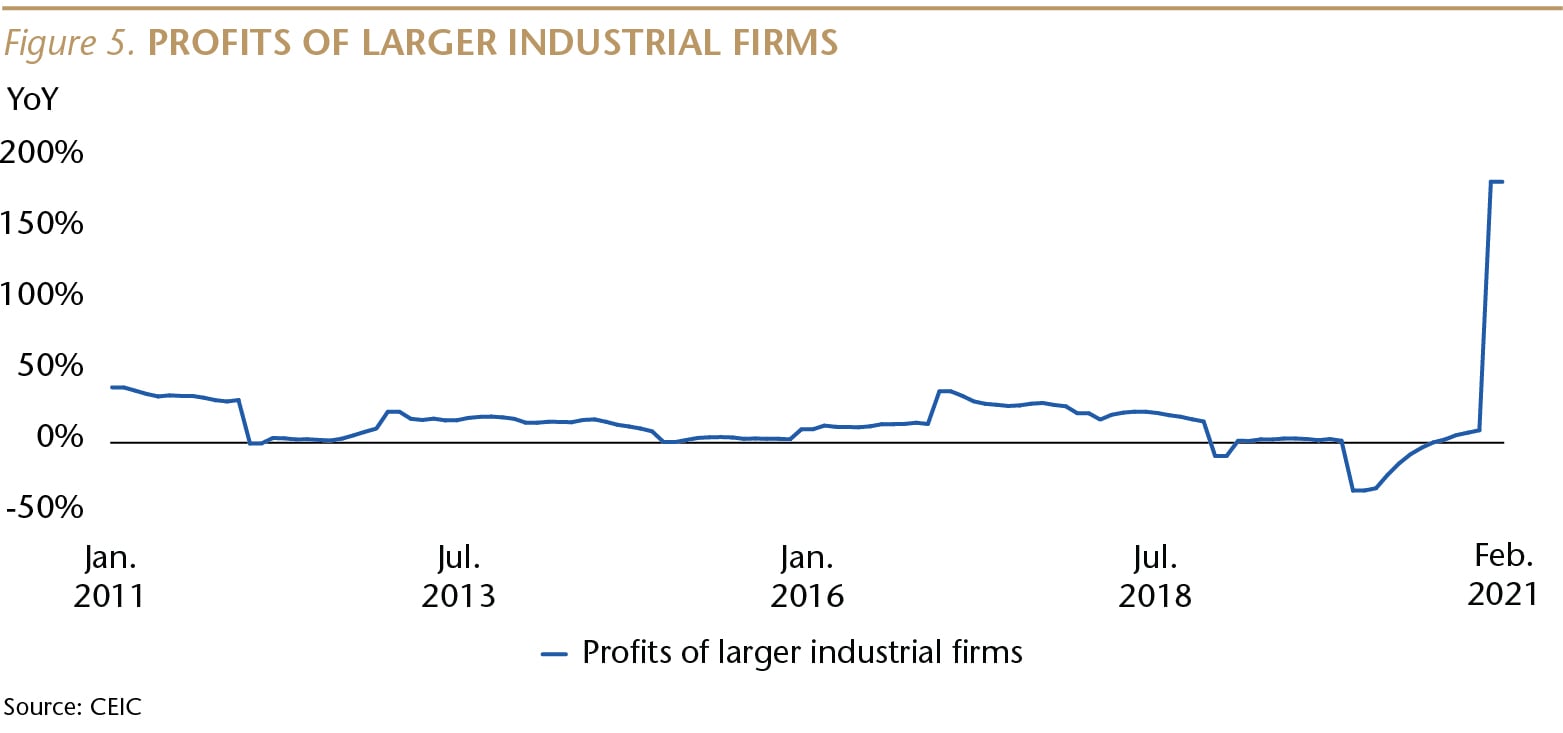
Overtightening Unlikely
Last month’s new flow of Total Social Finance (TSF, the broadest metric for credit in China) was 36% lower than in March 2020, but that is due to the base effect, as China’s modest stimulus kicked in a year ago.
A better perspective is that last month’s new flow of TSF was 12.8% higher than in March 2019, before COVID.
During 1Q21, the new flow of credit was 7.9% lower than in 1Q20, but was 19% higher than in 1Q19. Normalization, not tightening.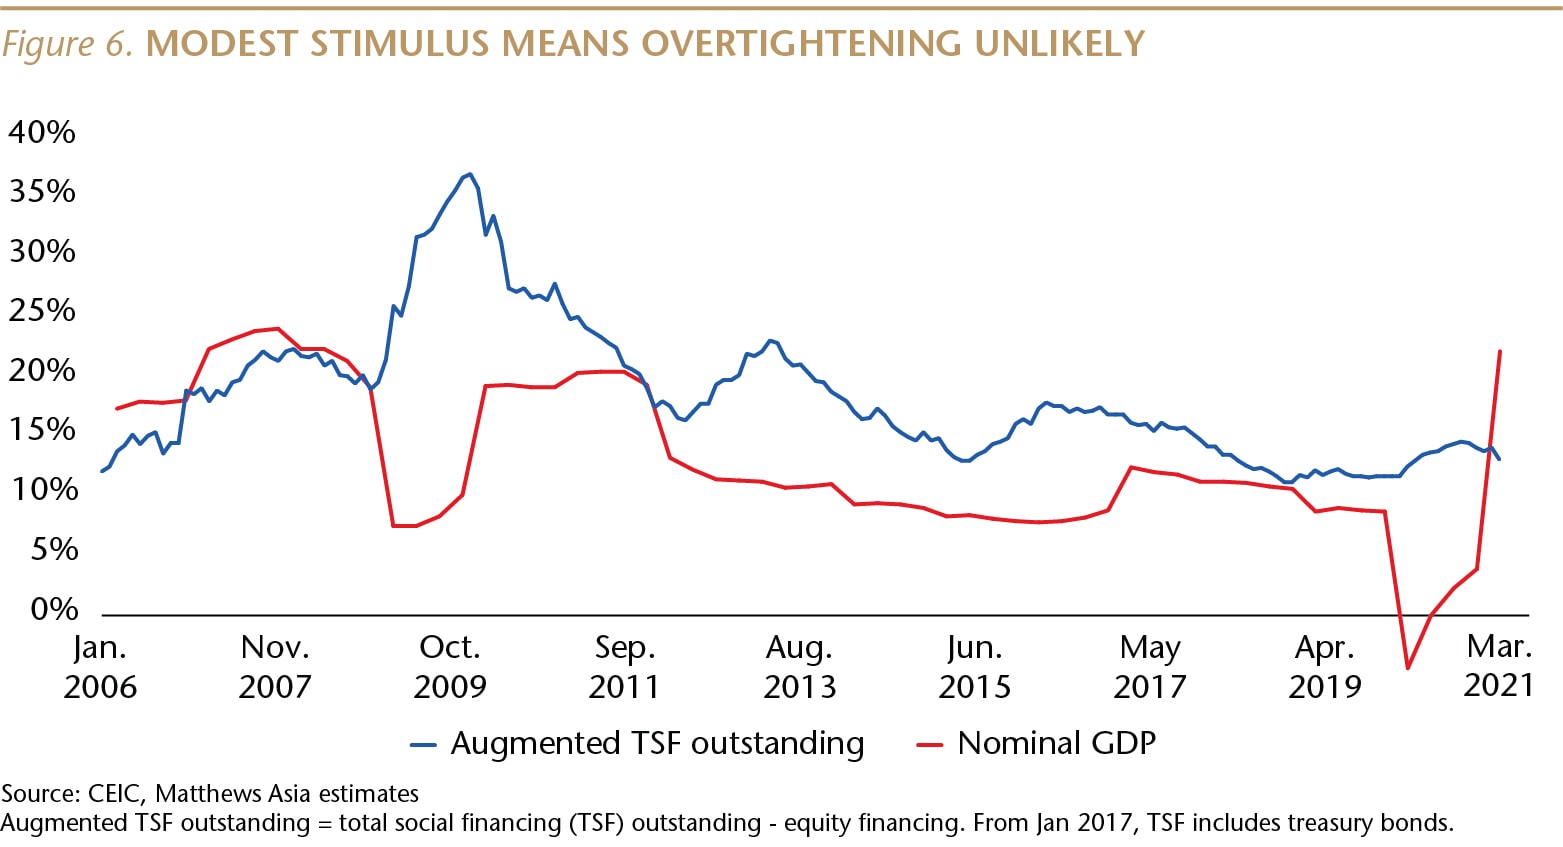
Digging deeper, it looks like mortgage demand remained healthy last month. Mid- and long-term new loans to households were RMB 624 billion vs. 474 billion a year ago and 461billion two years ago.
Corporate credit demand also looks healthy. Mid- and long-term new corporate loans were RMB 1.33 trillion last month, up from 960 billion a year ago and 650 billion two years ago.
And China’s financial sector de-risking campaign continued last month, the 34th consecutive month in which shadow (off-balance-sheet) loans outstanding declined YoY.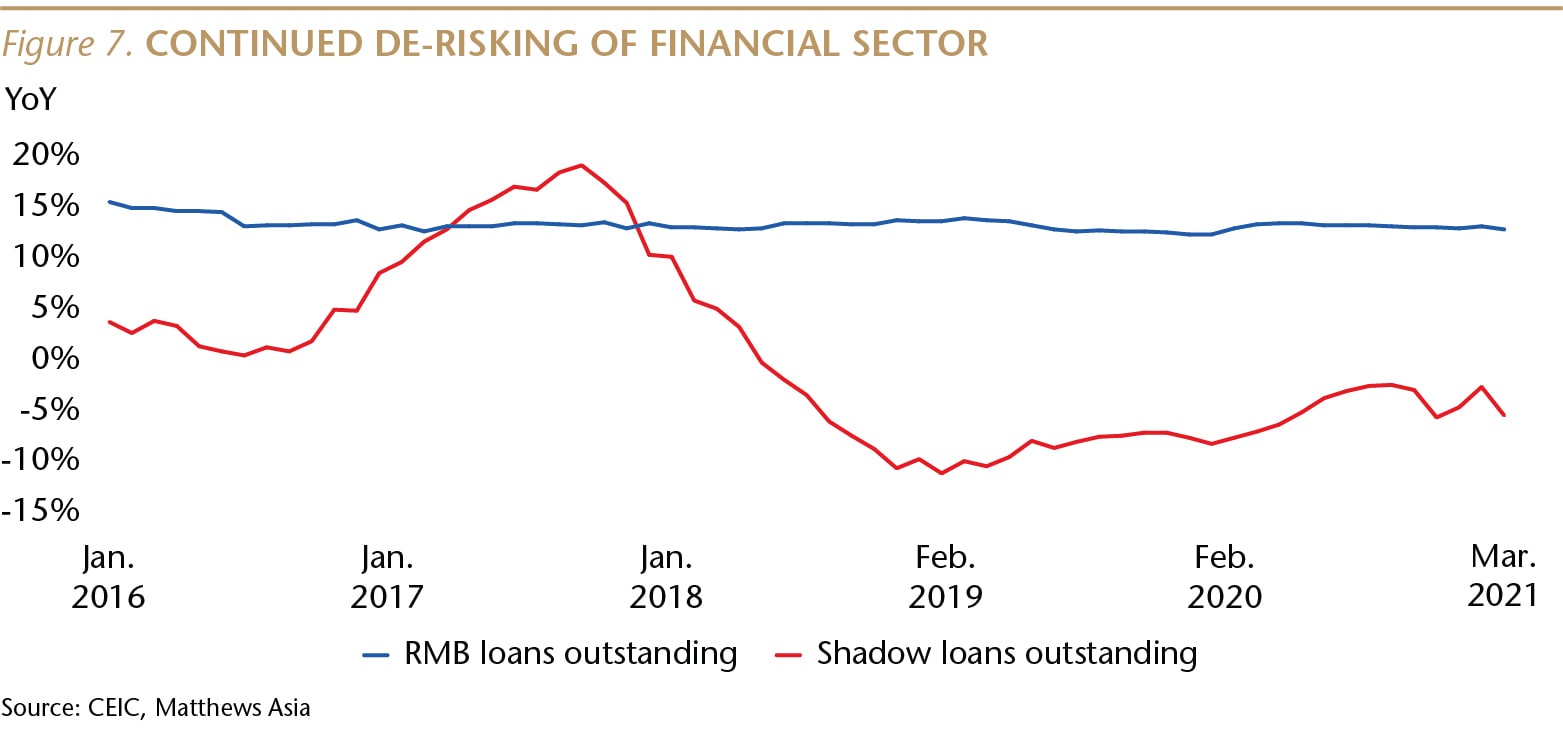
Political tensions shouldn't disrupt economic recovery
Finally, a few words about politics. U.S. – China relations have remained rocky during the early days of the Biden administration, but this should have a modest impact on the Chinese economy, which is fueled primarily by domestic demand, not exports.
It’s also worth noting that the tariffs put in place by the prior American administration did not put pressure on China’s exports, or on policy-makers in Beijing. Despite the tariffs and political tensions, the share of total manufactured goods imports coming into the U.S. from China last year returned to the historical high of 22%, last reached in 2016. In addition, China’s share of global exports hit an all-time high of almost 15%, and China continued to drive global economic growth.
Moreover, an investment strategy focused on the domestic demand story—Chinese companies selling goods and services to Chinese consumers—should remain well insulated from bilateral political tensions.
Andy Rothman
Investment Strategist
Matthews Asia
As of 3/31/2021, accounts managed by Matthews Asia did not hold positions in Nike, Inc.